Global Barometers continue to rise
The Global Barometers rise for the second consecutive month in March 2023, fueled by the favorable evolution in the economic environment of the Asia, Pacific & Africa region.

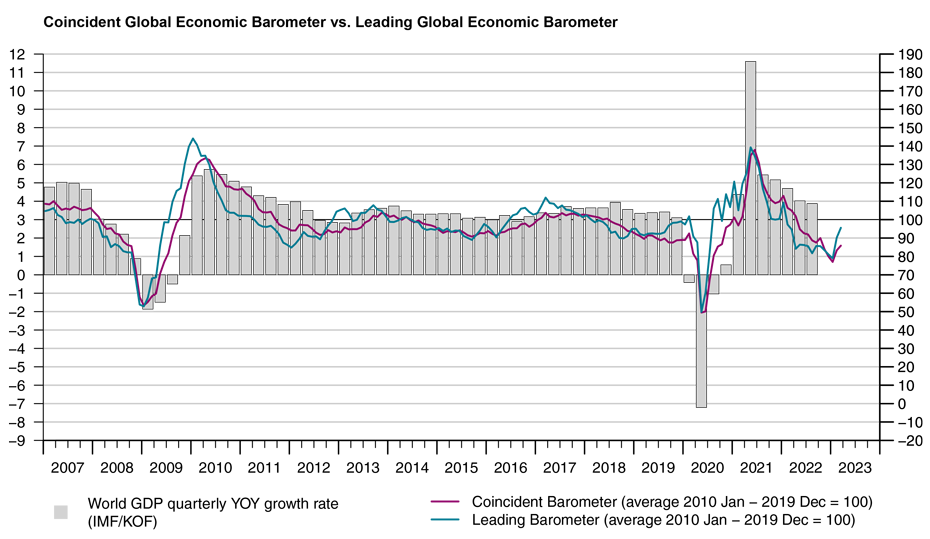
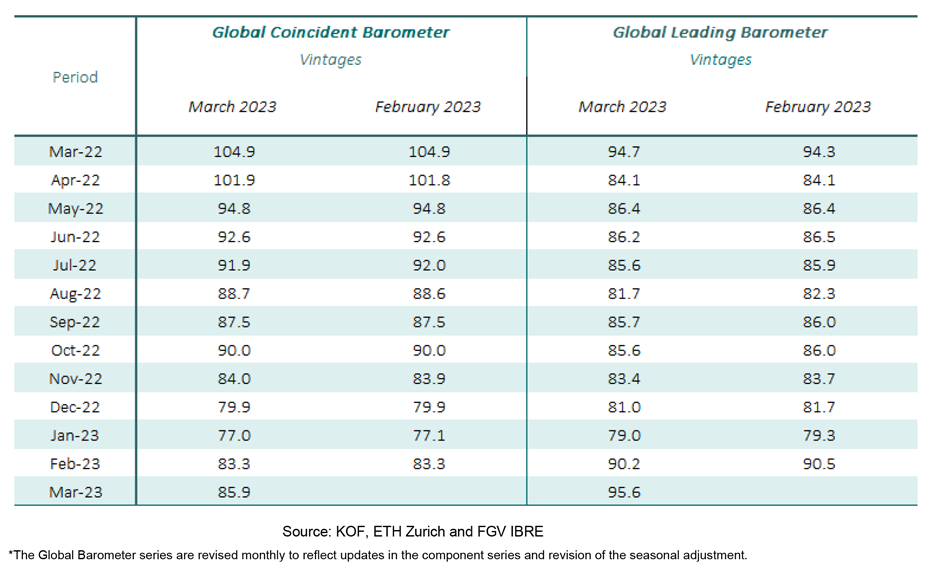
In March 2023, the Coincident Global Economic Barometer rises 2.6 points to 85.9 points, the highest level since October 2022 (90.0 pts.). The Leading Global Economic Barometer climbs 5.4 points to 95.6 points, the highest level since February 2022 (97.4 pts.). The increase in the aggregate indicators in March was driven exclusively by the advance in the Asia, Pacific & Africa region, while the other regions remain stable or decline.
“As was the case last month, the improvements in the global economic barometers are being driven by the Asia-Pacific and Africa regions. In particular, the opening up of China is likely to play a key role. The increasing decoupling of the construction sector from the rest of the economy is also striking. The continuing rise in global interest rates could be an important factor behind this”, evaluates Jan-Egbert Sturm, Director at KOF Swiss Economic Institute.

“As was the case last month, the improvements in the global economic barometers are being driven by the Asia-Pacific and Africa regions. In particular, the opening up of China is likely to play a key role.”Jan-Egbert Sturm, Director at KOF Swiss Economic Institute
Coincident Barometer – regions and sectors
In March, the Asia, Pacific & Africa region contributes 2.9 points to the 2.6-point increase in the Coincident indicator, while Europe makes a negative contribution of 0.3 points and the Western Hemisphere has a null contribution. The rise in the regional indicator for the Asia, Pacific & Africa region continues to reflect the reopening of the Chinese economy, with the end of the Covid zero policy and the recovery in growth. The graph below illustrates the contribution of each region to the deviation of the Coincident Barometer from the historical mean of 100 points.
All the coincident sector indicators increase in March 2023 except Construction, which moves in the opposite direction and drops further behind the other sectors. The distance between the Construction indicator and that of the Services sector, the highest difference at the present time, now exceeds 25 points.
Leading Barometer – regions and sectors
The Leading Global Barometer leads the world economic growth rate cycle by three to six months on average. The result of the Leading indicator follows the same tendency as that of the Coincident Barometer, with the Asia, Pacific & Africa region contributing positively with 6.9 points to the 5.4-point rise in the indicator, while Europe makes a negative contribution of -1.5 points and the Western Hemisphere remains stable for the month. This is the second positive contribution of a high level from the Asian region, while this month’s result for Europe is the first negative contribution since September 2022.
All the Leading indicator sectors increase in March, with Trade and the indicator for the general state of the Economy (aggregated business and consumer evaluations) standing out with rises of 11.0 and 9.5 points, respectively. As in the case of the Coincident indicator, Construction has the lowest level among the sectors.
The Global Economic Barometers
The Global Economic Barometers are a system of indicators enabling timely analysis of global economic development. They represent a collaboration between the KOF Swiss Economic Institute of the ETH Zurich in Switzerland and Fundação Getulio Vargas (FGV), based in Rio de Janeiro, Brazil. The system consists of two composite indicators, the Coincident Barometer and the Leading Barometer. The Coincident Barometer reflects the current state of economic activity, while the Leading Barometer provides a cyclical signal roughly six months ahead of current economic developments.
The two Barometers comprise the results of economic tendency surveys conducted in more than 50 countries with the aim of achieving the broadest possible global coverage. The advantages of economic tendency surveys are that their results are usually readily available and are not substantially revised after first publication.
The Coincident Barometer includes more than 1,000 different time series, while the Leading Barometer consists of over 600 time series. Cross-correlation analysis is used to decide which individual time series are included in the barometers. This involves correlating the individual time series with a reference series. The reference series used is the year-on-year growth rate of global gross domestic product (GDP), where the individual national GDPs are aggregated at purchasing power parity to form global GDP. A time series is only included in a Barometer if it shows a sufficiently high correlation and a suitable synchronization or lead with the reference series. The time period used for this correlation analysis currently runs from January 2010 to December 2019.
The series of the two Barometers are revised each month at publication and are standardized to have a mean of 100 and a standard deviation of 10 for the 10-year period previous to the most recent observations.
The methodology is described in:
Klaus Abberger, Michael Graff, Aloisio Jr. Campelo, Anna Carolina Lemos Gouveia, Oliver Müller and Jan-Egbert Sturm (2020), The Global Economic Barometers: Composite indicators for the world economy. KOF Working Papers, vol. 471, Zurich: KOF Swiss Economic Institute, ETH Zurich, 2020.
Contact
KOF Konjunkturforschungsstelle
Leonhardstrasse 21
8092
Zürich
Switzerland