How monetary policy can be deciphered using language analysis
Central banks shape global financial markets through their carefully crafted speeches. Words often trigger immediate market reactions and provide a more timely signal than many regularly updated economic indicators. When compiling its analysis, KOF uses natural language processing to decode indicators from central bank transcripts that make it possible to replicate and predict market movements in a timely manner.
The minutes of the Federal Open Market Committee (FOMC) meetings are an important tool for communicating the Committee’s discussions and decisions on economic policy and conditions to the general public and market participants. The language used is clear but also contains subtly embedded, nuanced expressions and hints of future economic policy measures and actions, making the analysis and interpretation of these documents critical to understanding future economic and policy directions.
While one can manually interpret the language and derive insights from it, the use of computer methods makes it possible to systematically and reproducibly extract specific indicators from the text and turn the nuanced language into quantifiable data for economic forecasting.
In this context, KOF uses simple Natural Language Processing (NLP) methods and employs a dictionary-based approach that allows the text to be analysed computationally and specific indicators to be formulated. This relatively simple but effective approach helps extract relevant information from the FOMC minutes and transform the text data into quantifiable indicators that can be used for economic forecasting.
Decoding economic indicators
The method aims to identify key economic terms (see chart G 2 – the size of the key terms shown is relative to their frequency) in the text and to check the surrounding words for their positive or negative connotations. The basis of the assessment is the Loughran dictionary, which was developed specifically for financial content. This ensures that the sentiments identified are in the context of economic and financial discussions.
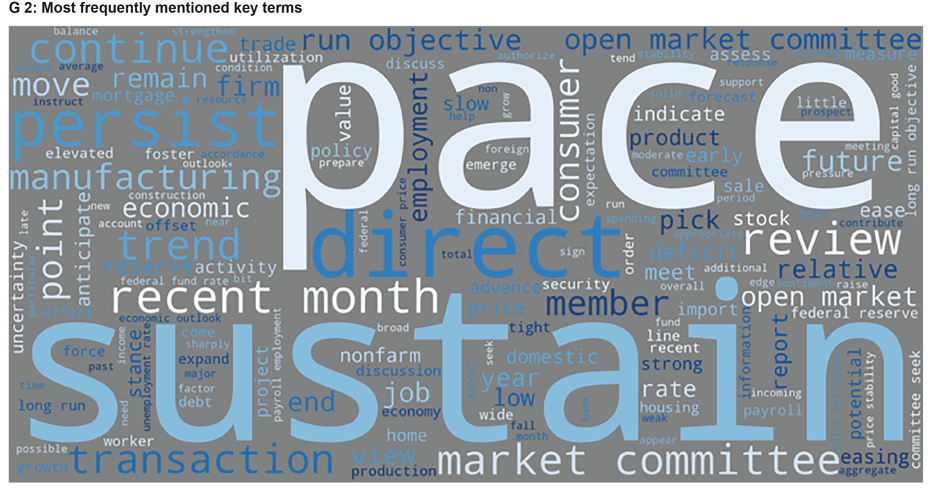
In practice, this means that this method detects the most common terms in the text such as ‘inflation’ and ‘unemployment’. This approach then checks the 20 words closest to the respective key term for their sentiments – positive or negative – in the dictionary. Finally, an average is created for each term and publication date. The result is a time series representation of sentiments on various economic aspects.
A look at the net general sentiment (see chart G 4) derived from the method shows possible correlations with economic events and crises. It is noticeable that the average general sentiment (represented by the grey line) tends to be negative during most economic crises (highlighted in light red).
Representation of individual indices
While word time series can provide valuable insights into economic sentiment, they can be subject to fluctuations owing to their sporadic nature and infrequent occurrences. The method presented therefore combines multiple word time series to create an aggregate of words that provides a clearer and more stable representation of the underlying economic variables. By using machine learning methods, the word time series are automatically selected and combined to form an index.
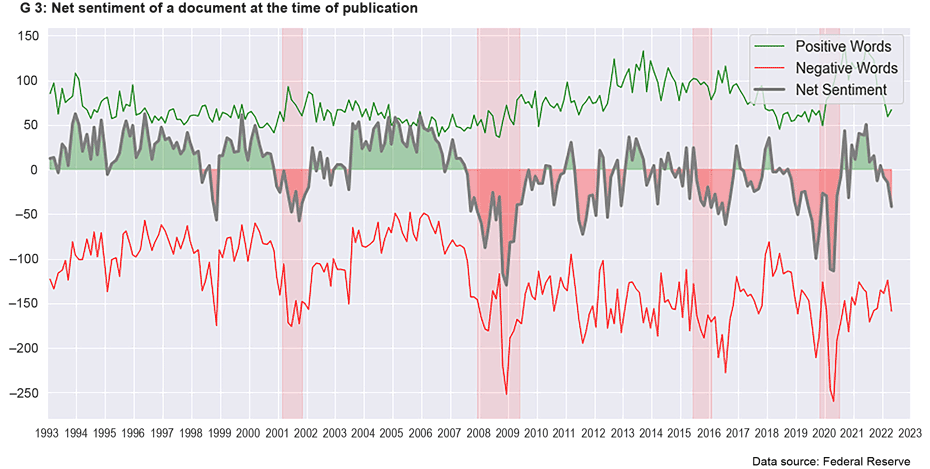
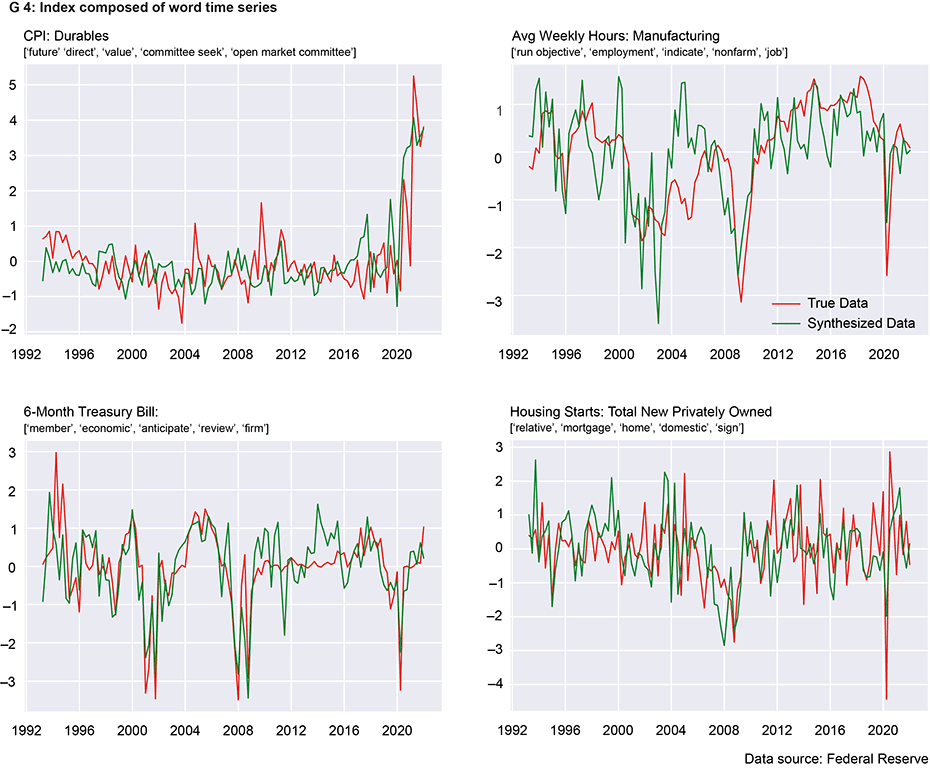
Chart G3 provides a visual overview of the indices created. Each sub-chart visualises a specific economic variable represented by two standardised lines: the green line represents the index generated by harmonising the sentiments of selected keywords (listed in the sub-title), while the red line represents the data actually observed.
One example of this is the ‘inflation’ index (CPI Durables), which is composed of the word meanings ‘future’, ‘direct’, ‘value’, ‘committee seek’ and ‘open market committee’. Looking at the chart, we can see that the green line representing our constructed index is remarkably close to the actual unemployment figures (red line). A similar pattern can be observed in the ‘hours worked’ chart, where the index is synthesised from terms such as ‘employment’, ‘indicate’, ‘non-farm’ and ‘job’.
Not all words used to create the indices are directly related to the economic variable being tracked per se. Words like ‘committee’, ‘future’ and ‘run objective’ are often mentioned in the minutes and therefore capture a general sentiment. The algorithm then selects these words and mixes them with the targeted words. The result is thus less characterised by outliers.
The way forward: real-time data from text
This analysis of the FOMC minutes enables us to create indices that can track the trend of real ratios. It should be noted that many economic variables are updated with a lag of several months. In situations where timely information is valuable, such as in times of crisis, indices derived from text data provide an additional perspective. It remains to be seen to what extent this method offers concrete advantages for economic forecasting. KOF continues to pursue this research to better understand the potential and limitations of using text data for economic forecasting.
Contact
KOF FB Konjunktur
Leonhardstrasse 21
8092
Zürich
Switzerland