
How digital technologies are enhancing modern economic research: a workshop report
High-resolution aerial photographs – evaluated using machine-learning techniques – can be used to create success indicators for construction projects in Switzerland. Until now it has not been possible to measure whether planned construction projects have been implemented or not. The initial results of a KOF pilot project indicate that many construction projects have remained unfinished – especially in the wake of the 2012 second-home initiative.
As the complexity and size of the available data sets increase, the methods used by economists and the need for more elaborate computational methods are changing. Economic research increasingly relies on machine-learning methods both for data generation and for the evaluation of large data sets. A rough distinction can be made between two directions: neuro-linguistic programming (NLP) methods (i.e. data from text) and computer vision (i.e. data from images).
Text as a data source has been popular for some time. In finance, for example, texts from financial news, social media and company reports are used to predict the performance of asset prices and to investigate the causal effects of new information. In macroeconomics, for example, texts are also used as data sources to predict fluctuations in inflation and unemployment, to assess the impact of policy uncertainty and to better understand monetary policy decisions (Baker, Bloom and Davis, 2016; Tetlock, 2007; Anderes, Rathke, Streicher and Sturm, 2021).
Images as a data source: underestimated potential
In contrast, the use of images as a data source is not yet as widespread in research. This is probably because images of consistent quality are difficult to obtain, and access to them is often limited. Exceptions to this rule are found particularly in development economics. For example, slum development is studied by looking at roofing materials, and the quality of beaches and water bodies is analysed using images of tourism (Faber and Gaubert, 2019). Urban structures and inequalities can also be studied using images, e.g. brightness at night can be used for this purpose (Galimberti, Pleninger and Pichler, 2021).
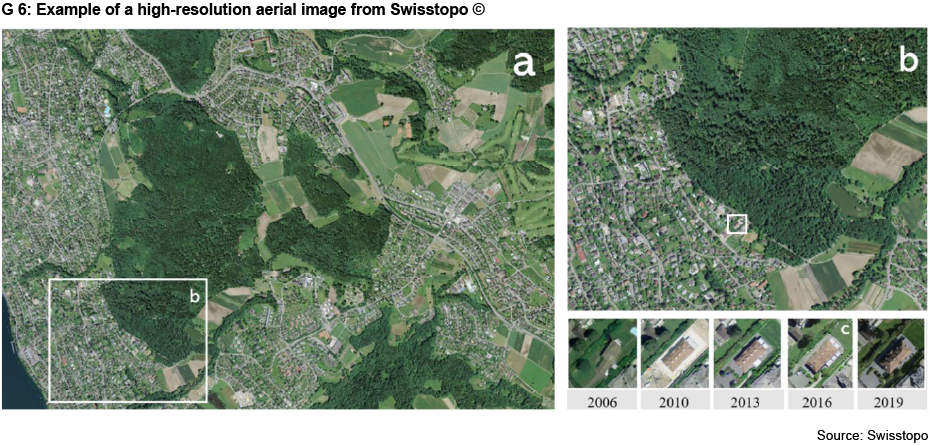
KOF has recognised the potential offered by image files and is using them for a new pilot project. The data source is high-resolution image data provided by the Federal Office of Topography (Swisstopo) for research purposes (see G 6). These images are being used to determine whether building permits have been implemented in Switzerland. A ‘workshop report’ on the building success indicator is presented below.
The creation of the building success indicator
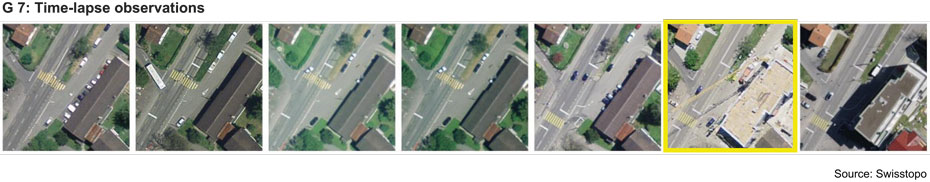
The basic idea of the building success indicator is simple. Parts of images are used that represent building projects at different points in time. If the difference between one part of an image and the next is significant so that, for example, an altered building can be seen on it, this results in a signal indicating new construction. If this is not the case, there is no such signal. In the image below (G 7), for example, there should be a signal indicating new construction (sixth image from the left).
Although the basic idea is simple, the project poses a few problems. Firstly, the creation of the image series is extensive and requires a process that relies on the coordinates of a particular building permit. Chart 1 illustrates this process. An enlargement is created for each observation step-by-step.
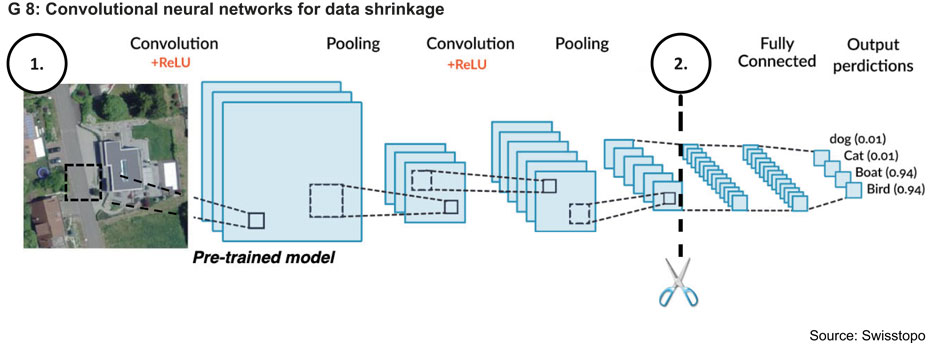
On the other hand, classical statistical methods are unsuitable for analysing image alterations. Each pixel shown in red, yellow or green determines an input parameter, which corresponds to more than 150,000 variables per image. It is therefore necessary to reduce the amount of data and, as a second step, to build a model on top of it that makes it possible to achieve significant progress in classification using less training data. This process is called transfer learning.
Transfer learning uses models whose parameters have already been set using labelled data, but which have little to do with remote sensing images and may refer to different sub-categories (e.g. animals, furniture and other objects). Nevertheless, these models – based on convolutional neural networks (CNNs)1 – can extract edges, colour combinations and principal components from images. This is done over several layers (see G 8). So-called ‘convolutional layers’ combine pixel matrices into vectors like filters (shown in step (1.)). Before these can be used further to classify an object, the network is terminated (shown in step (2.)). The vectors obtained are now a greatly reduced version of an image.
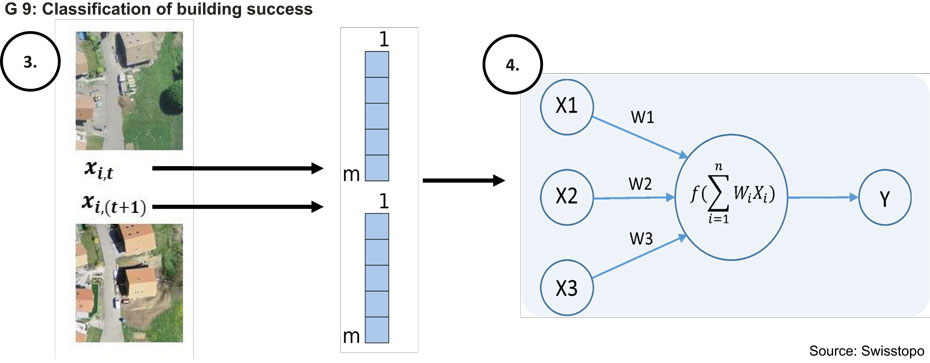
The described vectors are then presented again in G 9. The vectors are subtracted from each other and form the input for a new model (shown in step (4.)). The selected model (4.) can now work with significantly fewer input parameters (X1, X2, X3) and achieves a hit rate of over 85 per cent using our data as an example. Considering the fact that many construction sites can hardly be distinguished from new buildings from the air, these are extremely good results.
The results of the building success indicator
Chart G 10 shows the results of the described procedure and the final building success indicator. The Y-axis indicates the aggregated average compliance rate, i.e. whether the building application was classified as successful (+1) or unsuccessful (-1) by the algorithm. The data was normalised so that the average equals zero and the variance equals one. In order to test the significance of the generated success rate, the focus is on the second-home initiative, which came into force on 11 March 2012 and imposed a ban on new second homes as soon as the proportion of second homes in a given municipality exceeds 20 per cent. The grey bar in the chart represents the period between the introduction of the initiative and 31 December 2012. The hypothesis is that fewer building projects were successful because of this initiative.
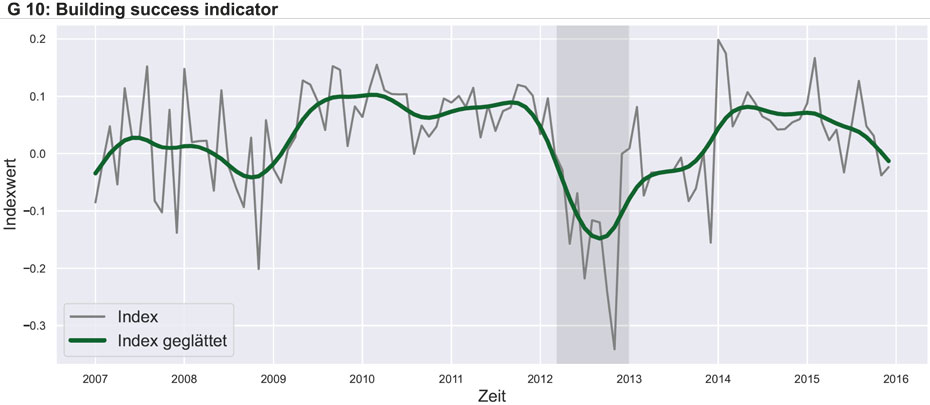
The chart shows a sharp drop in the building success indicator from the time the initiative came into force, hitting a low in autumn 2013. This can probably be explained by the fact that the surprising outcome of the vote triggered a flood of applications, which were disproportionately submitted by those who were still hoping for their building project to be implemented before the initiative came into force. These applications are likely to have been subject to inferior planning or to have been affected by the ban. The resulting compliance rate is therefore significantly lower during this period and is also reflected in the chart. More detailed analysis of the building success rate is needed in order to exclude external factors so that causal conclusions can be drawn from this pilot project.
Finally, the use of these algorithms and image data presents an enormous opportunity for the economics profession, especially as more and more petabytes of satellite images enter the public domain and modern cloud-based computing power becomes available. Given the increasing importance of environmental issues, their significance for the social sciences is also likely to grow and a more intensive engagement with aerial imagery can be expected.
-----------------------------------
1 Roughly simplified, CNNs are multi-layered neural networks that are mainly used in image processing.
Literature
Anderes, Mark, Alexander Rathke, Sina Streicher, and Jan-Egbert Sturm (2021): external pageThe role of ECB communication in guiding markets. Public Choice 186:3-4, 351-383.
Baker, Scott R., Nicholas Bloom, and Steven J. Davis (2016): external pageMeasuring economic policy uncertainty. The Quarterly Journal of Economics 131:4, 1593-1636.
Faber, Benjamin, and Cecile Gaubert (2019): external pageTourism and economic development: Evidence from Mexico's coastline. American Economic Review 109:6, 2245-93.
Galimberti, Jaqueson K., Stefan Pichler, and Regina Pleninger (2021): external pageMeasuring inequality using geospatial data. No. 493. KOF Working Papers, 2021.
Tetlock, Paul C. (2007): external pageGiving content to investor sentiment: The role of media in the stock market. The Journal of Finance 62:3, 1139-1168.