Income and wealth over the life cycle
Using Swiss tax data, KOF economists Isabel Z. Martínez and Regina Pleninger are investigating the role of income and wealth over the life cycle as part of an ongoing research project. This article provides an initial insight into this work.

Ratio of assets to income
In macroeconomic research, the changes in the ratio of national wealth to national income over time have recently received increased attention (Piketty and Zucman, 2014; Baselgia and Martínez, 2021). An ongoing study by KOF economists Isabel Z. Martínez and Regina Pleninger now examines this relationship for the first time at the individual level and in terms of income distribution.
Since the Swiss cantons levy annual taxes on income and wealth, individual tax data provides a unique data basis for a detailed analysis of income and wealth. The data used here covers individuals from eight Swiss cantons (Bern, Lucerne, Obwalden, Aargau, St Gallen, Basel-Stadt, Jura and Zurich) in the 2010 tax year, which together account for over 50 per cent of the taxable population.
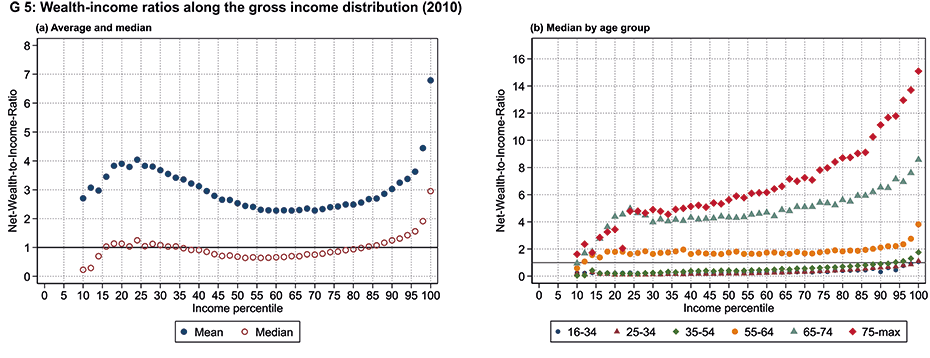
Chart G 5a shows the average and median ratios of wealth to annual income by income rank, so-called income percentiles (for better readability, two percentiles have been combined in the chart in each case). For individuals between the 15th and 85th ranks, the median is approximately constant at 1. The median individual within these income percentiles thus has approximately once their entire annual income in assets. People on low incomes generally have a lower ratio of assets to income, even though they need lower amounts of assets in absolute terms – given their low incomes – to achieve a high asset-income ratio. The opposite applies at the upper end of the income distribution, where assets rise disproportionately in relation to income. The median of the highest-income two per cent of taxpayers has about three years’ worth of assets. The average is almost seven. There is a strong positive correlation between the position in the income distribution and the position in the wealth distribution: those on high incomes typically also have high to very high wealth.
Chart G 5b again shows the median of this ratio per income percentile pair, but additionally differentiated by age group. The income percentiles are the same as those in Chart G 5a, so the income distribution always refers to the total population. This facilitates direct comparisons: those in the 50th income percentile are in the same fine-meshed income category, regardless of which age group is under scrutiny.
As a general rule, the ratio of wealth to income increases in all age groups along the income distribution. However, individuals under 50 years of age typically have low wealth in relation to their incomes. This also applies to higher ranks in the income distribution. For those in the age group of 51 to 64 years, i.e. shortly before retirement, the ratio is above 1. For pensioners, regardless of their rank, the ratio of assets to income is more than twice as high as for the rest of the population. This indicates the importance of wealth for older people, even for those in the bottom 25 per cent of the income distribution. Wealth and age are thus clearly positively correlated across all income categories.
Saving takes time, so it is not surprising that older people have higher assets than younger individuals. Inheritance also tends to occur in the second half of life, which further increases wealth. And a major portion of the assets of working-age individuals is missing from the tax data: those who do not touch their retirement capital from the second and third pillars before reaching retirement age (for example, to buy their own home) appear in the data as being poorer than they actually are. However, people under the age of 40 have usually saved only a fairly small amount of retirement capital, so the lack of pension capital in this age group should not affect the results too much.
Rise and fall in distribution over the life cycle
The study of mobility over the life cycle is based on tax data from the canton of Bern for the years 2002 to 2018. This data enables the changes in income and wealth at the individual level to be examined over a longer period of time. This analysis again classifies individuals according to their total income or wealth in the distribution in 100 percentiles. Consequently, each individual has a certain rank in the income and wealth distribution, with income and wealth increasing in absolute terms with each rank.
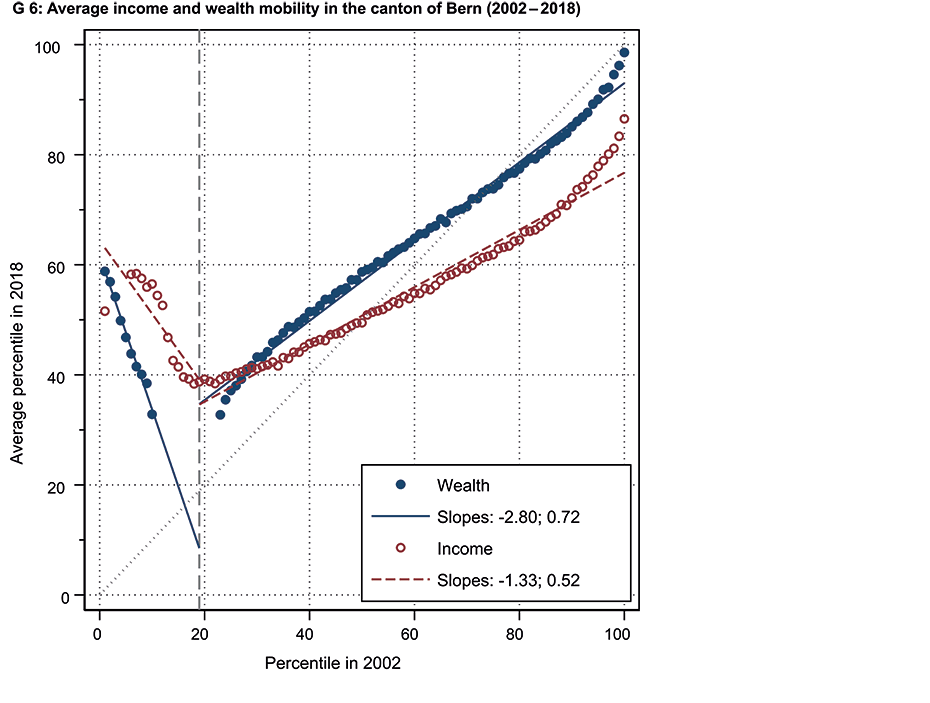
Chart G 6 shows the average ranks in 2018 (vertical axis) for the ranks in 2002 (horizontal axis). Wealth is shown in blue and income in red. For the top 80 per cent of taxpayers, the chart shows a positive correlation between their rank in 2002 and that in 2018. The points are very close to the 45-degree line, especially for wealth, which means that individuals change their rank in the distribution very little on average. Income mobility is higher than wealth mobility: the corresponding slopes are 0.52 and 0.72. The higher the slope coefficient, the more the 2002 rank is an indicator of an individual’s rank in 2018 and, conversely, the lower the mobility.
The situation is different in the lower income and wealth categories. There is a negative correlation for the bottom 20 per cent, i.e. those from the very lowest income and wealth segments have advanced up the income and wealth ranks during the 17 years studied (it should be noted that the absolute increases required in order to reach a higher rank grow over the distribution – in some cases dramatically). This finding is particularly notable in the case of income. One explanation for this is that earned income in particular rises over the life cycle. Younger people usually start on low incomes, which increase with age and work experience.
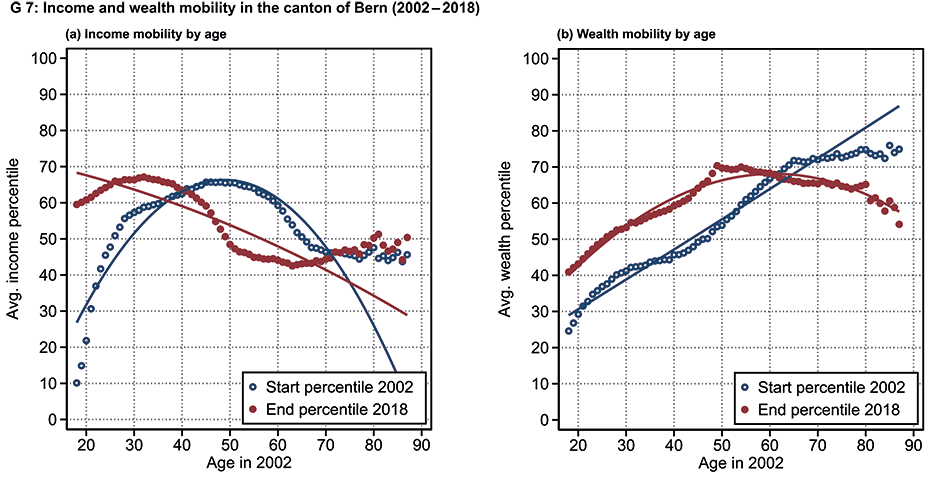
The importance of age in moving up and down the income distribution is shown in Chart G 7. For income, on average, individuals move up the income distribution until the age of 40 over the following 16 years, albeit at a decreasing rate. Subsequently, their incomes begin to fall on average and individuals are more likely to move down the income distribution over the next few years. Pensioners remain in the same position. With regard to wealth, on the other hand, individuals can assume that, on average, they will continue to move up the wealth distribution in the years after retirement age. This is due to their receipt of pension capital (instead of a monthly pension, which is defined as income) and to inheritances, which often only occur at retirement age.
Literature
Piketty, T. and G. Zucman (2014): Capital is back: Wealth-income ratios in rich countries 1700–2010. The Quarterly Journal of Economics, 129(3): 1255–1310.
Baselgia, E. and I. Z. Martínez, (2021): A Safe Harbor: Wealth-Income Ratios in Switzerland over the 20th Century and the Role of Housing Prices. CEPR Discussion Paper No. 16660 (October 2021).
Tax data provides detailed information on the income and wealth of the entire population. Both variables are measured, whereas many other data sources – such as data on old-age and survivors’ insurance (AHV) or survey data – often only show income. In contrast to survey data, tax data also covers individuals with very high incomes and wealth. This analysis refers to gross income less all welfare benefit deductions (this includes contributions to AHV, pension funds and unemployment insurance) but not less taxes. Unlike AHV data, this includes not only earned income but also investment income such as income from dividends, income from letting property, and pension benefits from the first and second pillars. This also makes it possible to illustrate the income situation of individuals who do not live (exclusively) on earned income. Of particular interest here is the growing number of pensioners.
Wealth is defined as the total net assets owned, although assets held in pension funds and in the third pillar before reaching retirement age are not included because these assets and their income are tax-free. The unit of analysis is the individual person. The income and assets of married taxpayers are divided equally between the two spouses.
Contact
KOF Konjunkturforschungsstelle
Leonhardstrasse 21
8092
Zürich
Switzerland
The World Bank
1818 H Street
DC 20433
NW Washington